A function to create a Red-Gray-Blue palette.
Arguments
- n
Number of colors to create
Value
A vector of n colors.
Details
Using gray instead of white allows missing values to appear as white
(actually, transparent).
Examples
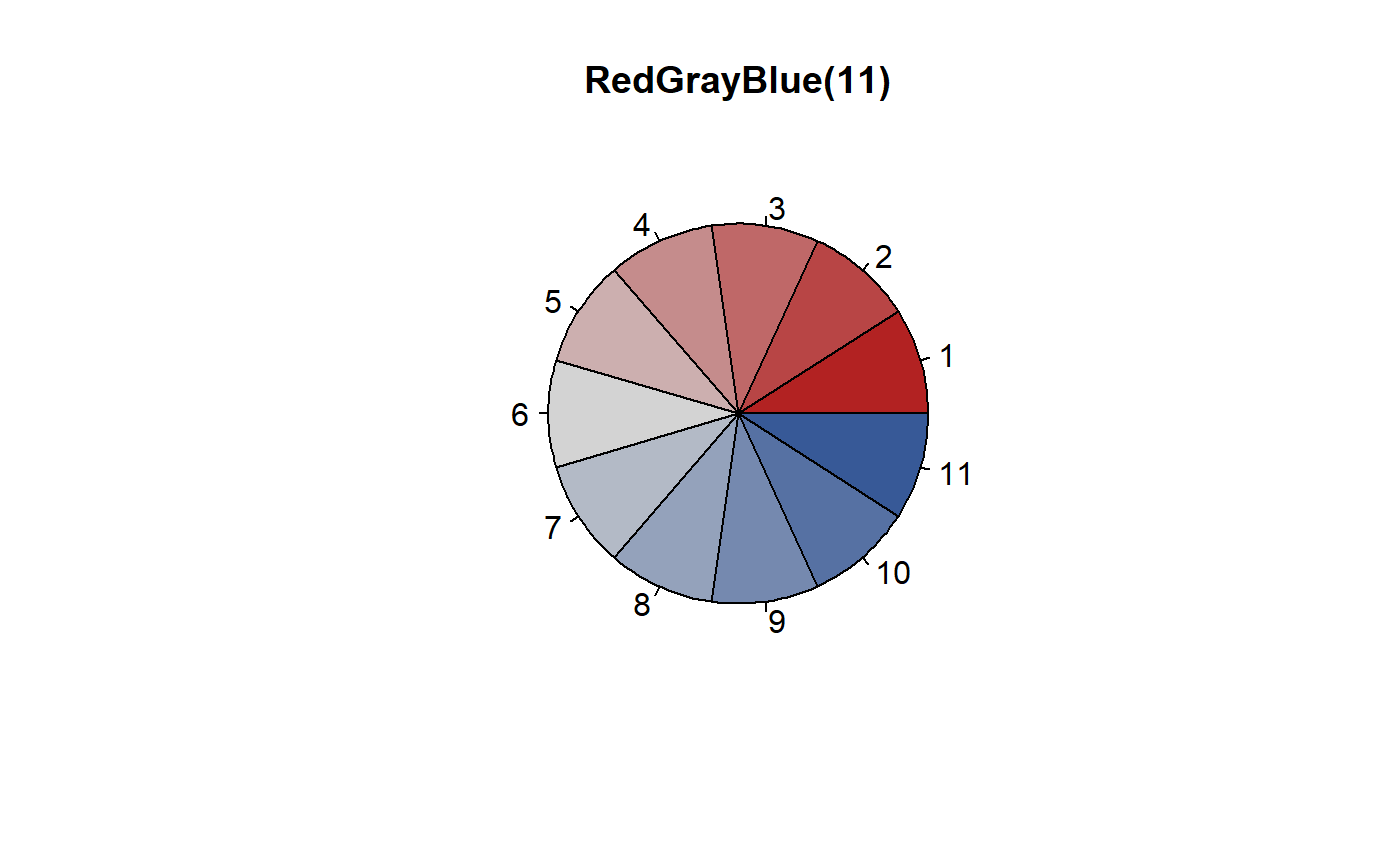
pie(rep(1,11), col=RedGrayBlue(11))
title("RedGrayBlue(11)")