Show palettes as colored bands.
pal.bands(
  ...,
  n = 100,
  labels = NULL,
  main = NULL,
  gap = 0.1,
  sort = "none",
  show.names = TRUE
)
Arguments
| ... | Palettes/colormaps, each of which is either (1) a vectors of colors or (2) a function returning a vector of colors. |
|---|---|
| n | The number of colors to display for palette functions. |
| labels | Labels for palettes |
| main | Title at top of page. |
| gap | Vertical gap between bars, default is 0.1 |
| sort | If sort="none", palettes are not sorted. If sort="hue", palettes are sorted by hue. If sort="luminance", palettes are sorted by luminance. |
| show.names | If TRUE, show color names |
Details
What to look for:
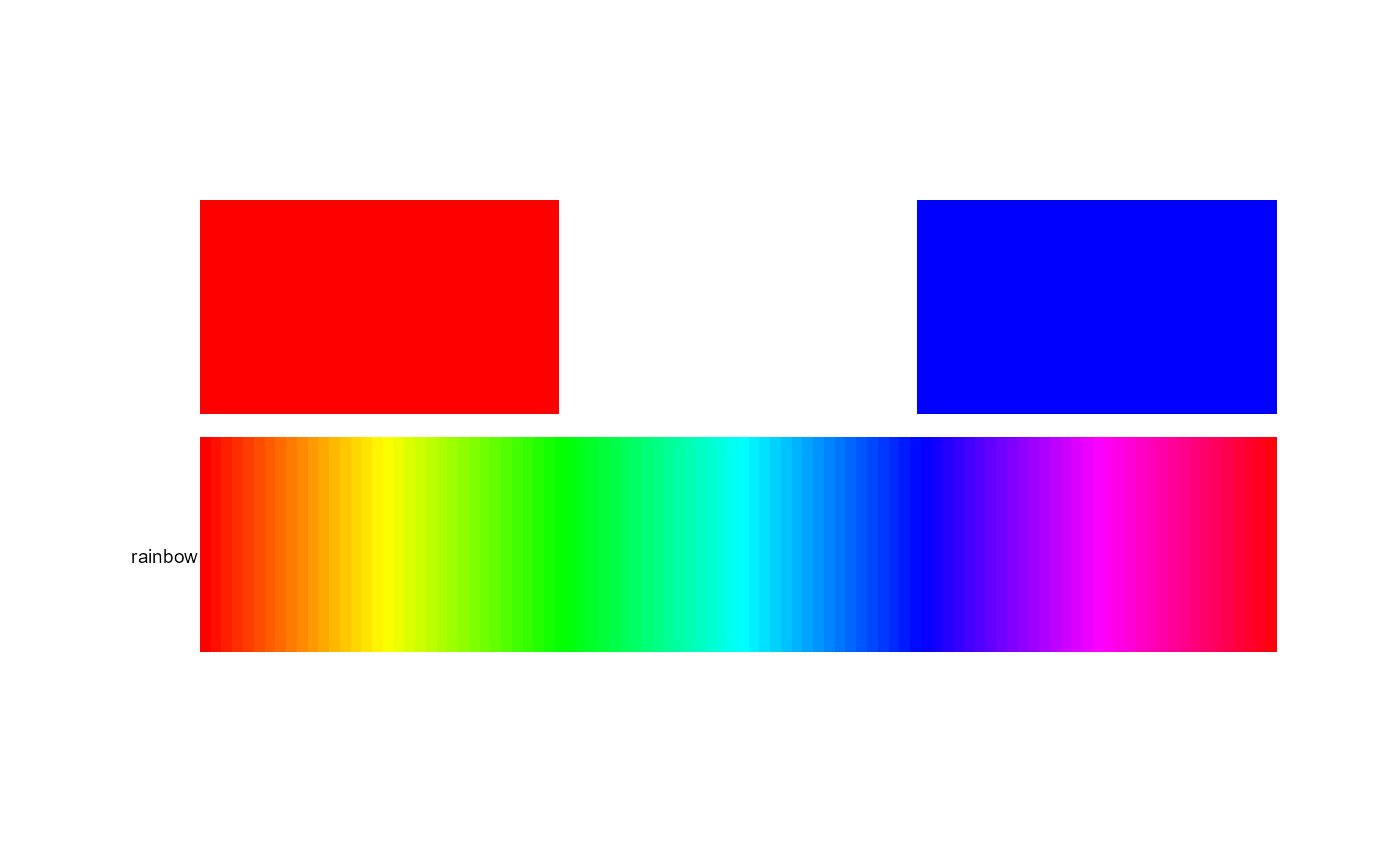
1. A good discrete palette has distinct colors.
2. A good continuous colormap does not show boundaries between colors.
For example, the rainbow() palette is poor, showing bright lines at
yellow, cyan, pink.
Examples
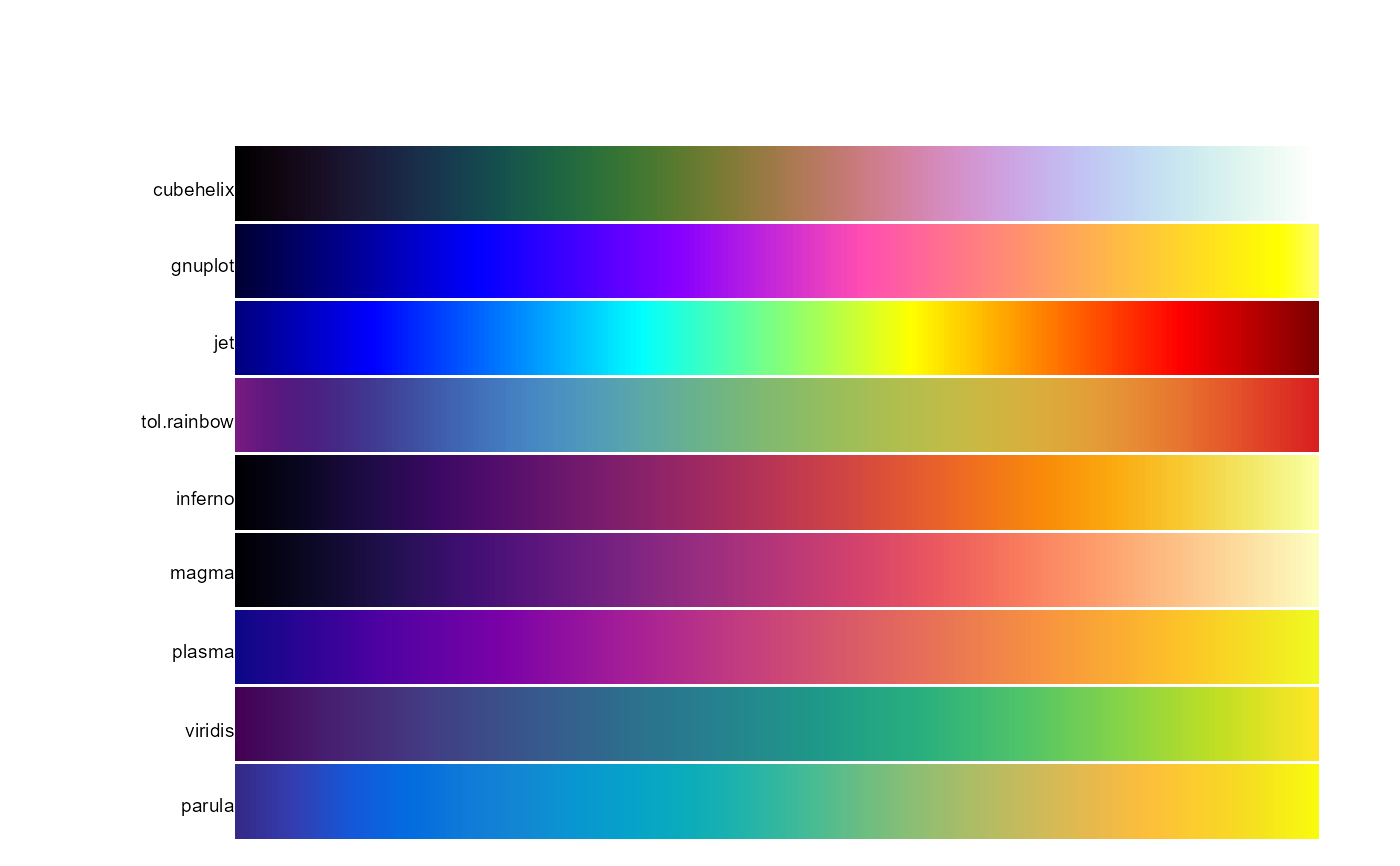
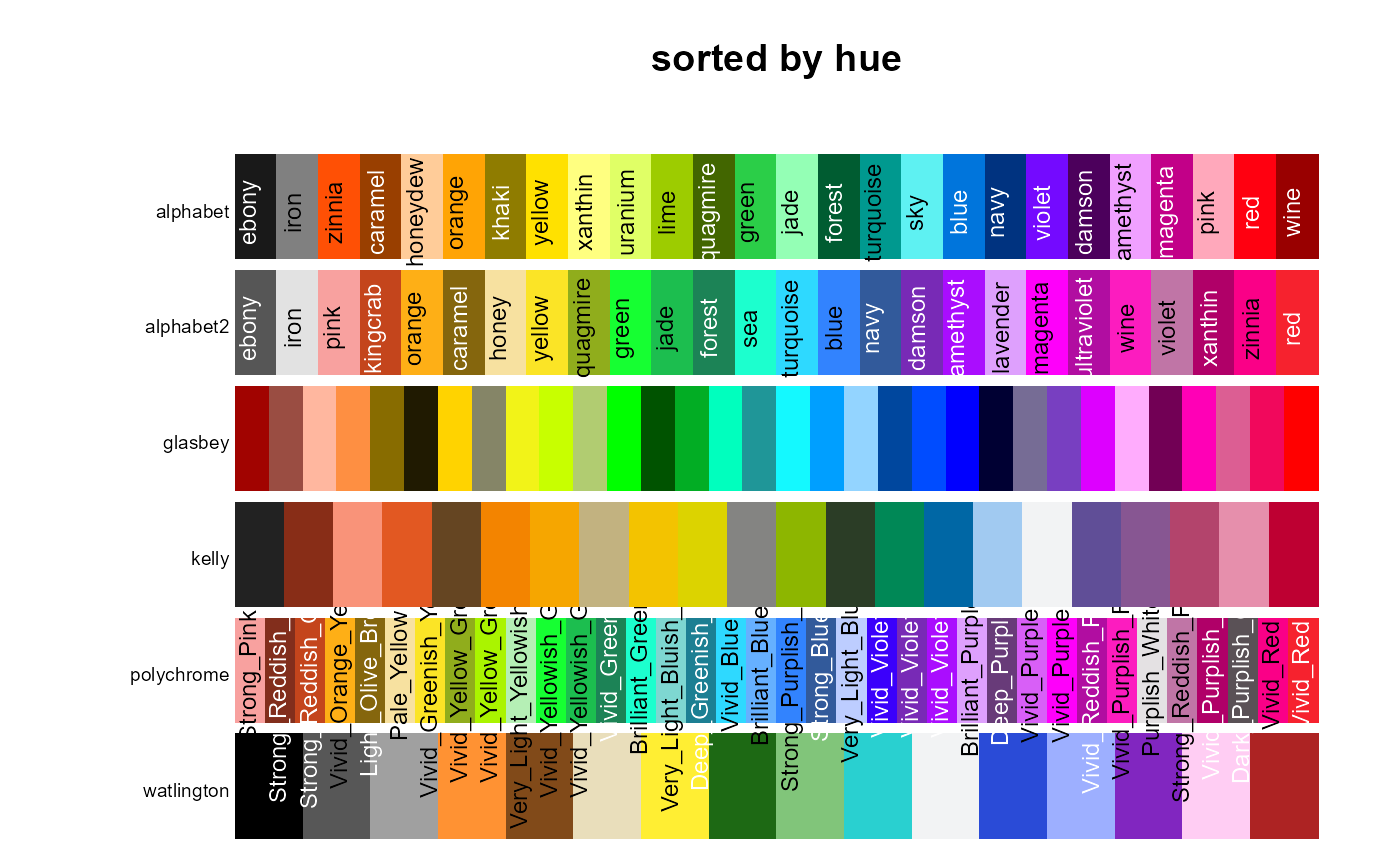
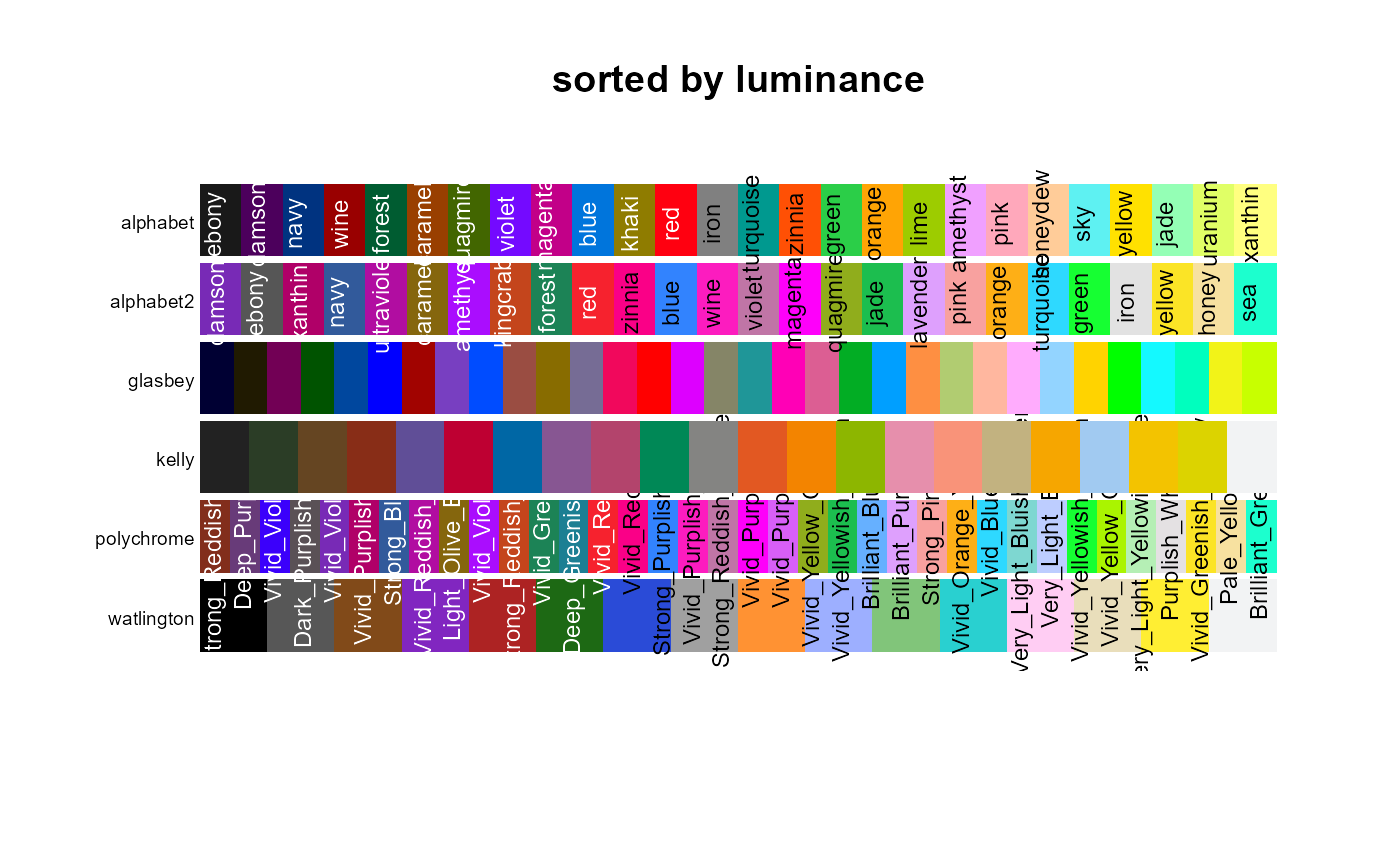
op=par(mar=c(0,5,3,1)) pal.bands(cubehelix, gnuplot, jet, tol.rainbow, inferno, magma, plasma, viridis, parula, n=200, gap=.05)par(op) # Examples of sorting labs=c('alphabet','alphabet2', 'glasbey','kelly','polychrome', 'watlington') op=par(mar=c(0,5,3,1)) pal.bands(alphabet(), alphabet2(), glasbey(), kelly(), polychrome(), watlington(), sort="hue", labels=labs, main="sorted by hue")par(op) pal.bands(alphabet(), alphabet2(), glasbey(), kelly(), polychrome(), watlington(), sort="luminance", labels=labs, main="sorted by luminance")