Disease progression in an alzheimer's trial
alzheimers.RdDisease progression in an alzheimer's trial
data("alzheimers")
Format
A data frame with 480 observations on the following 4 variables.
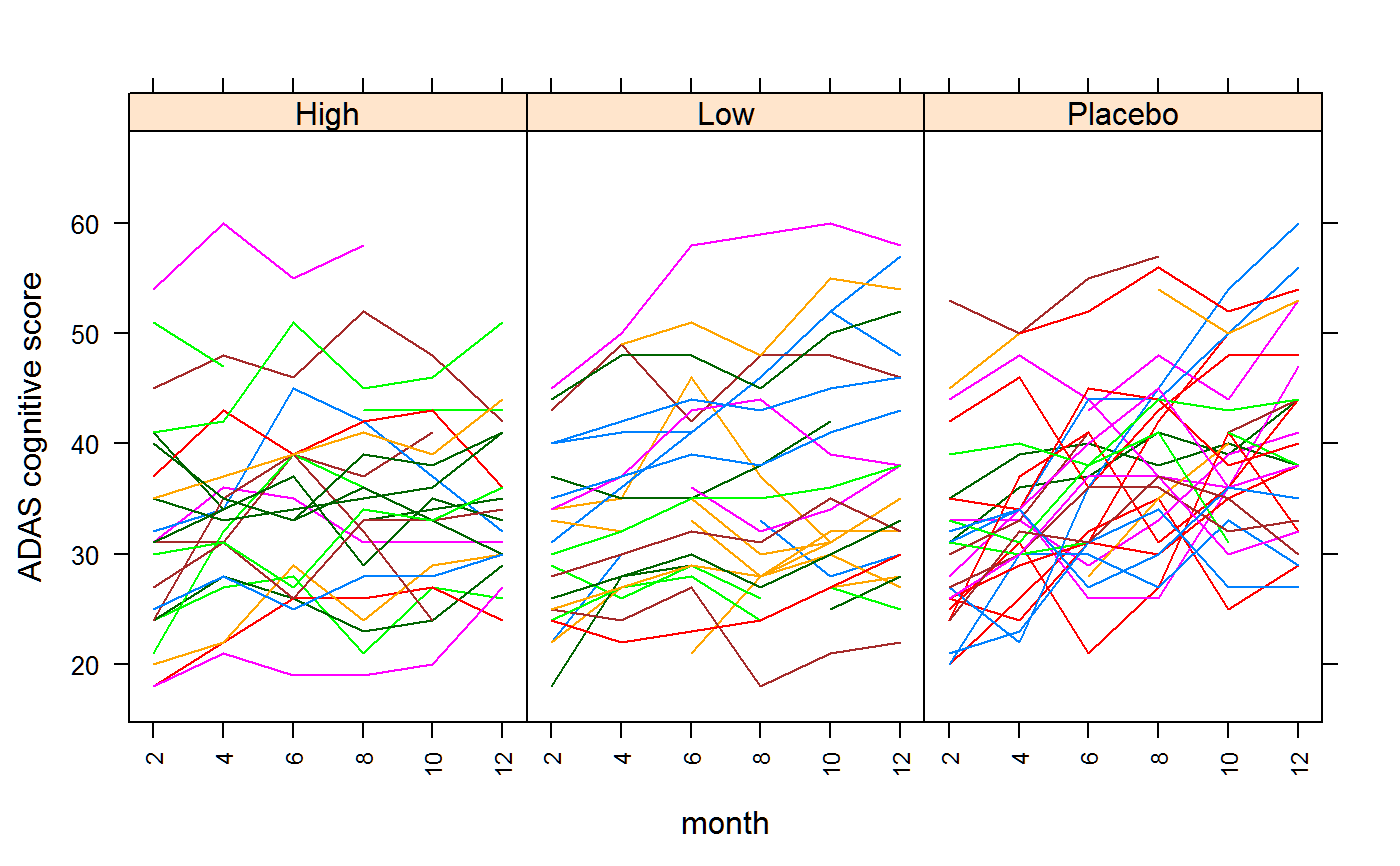
trtTreatment factor: Low, High, Placebo
patientPatient id number
monthMonth number: 2,4,6,8,10,12
scoreScore for disease
Details
Patents had two daily doses of placebo, low dose, or high dose of a treatment for Alzheimer's disease.
Patients were assessed every 2 months for 1 year.
Disease progression was measured with the Alzheimer's Disease Assessment Scale, which evaluates memory, language, and praxis function. Scores range from 0 to 70, with higher scores indicating greater severity of disease.
Key question: Do the treatments have different response profiles over time?
Source
Glenn Walker and Jack Shostack. 2010. Common statistical methods for clinical research with SAS examples. SAS publishing.
References
None.
Examples
#>xyplot(score ~ month|trt , data=alzheimers, groups=patient, xlab="month", ylab="ADAS cognitive score", type='l',layout=c(3,1), scales=list(x=list(rot=90, cex=.75, alternating=FALSE)))