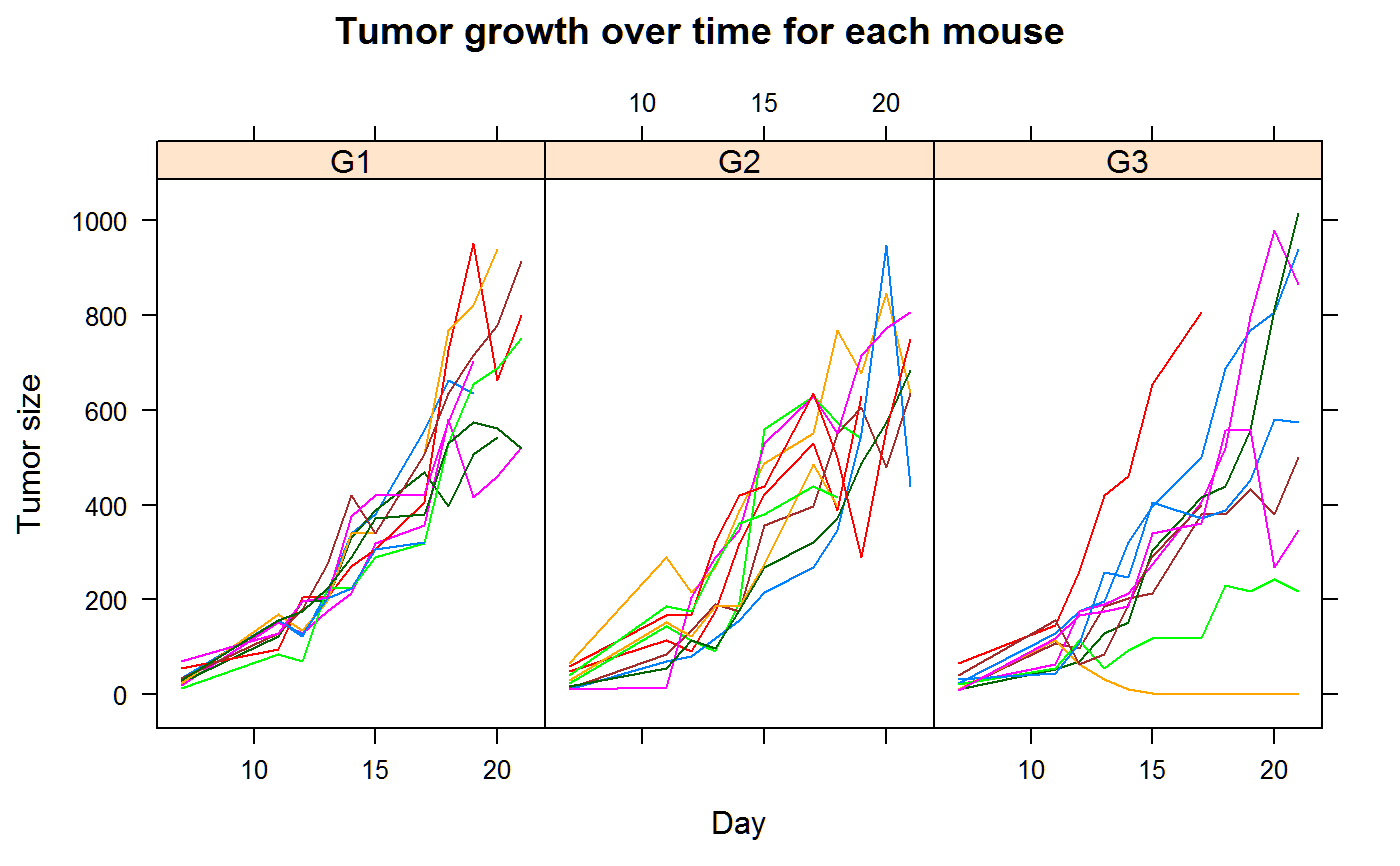
Growth of colon carcinoma tumors in mice.
tumor.RdGrowth of colon carcinoma tumors in mice.
data("tumor")
Format
A data frame with 330 observations on the following 4 variables.
groupFactor for group, 3 levels
mouseMouse id number
dayDay
sizeTumor size
Details
Three therapies were tested against colon cancer in mice. Mice were injected with mouse colon carcinoma cells and tumors were measured at times from 7 to 21 days.
Some mice died before the end of the experiment.
The tumor size was measured in cubic millimeters.
Source
James A. Koziol, Donna A. Maxwell, Matsuro Fukushima, M. E. M. Colmerauer and Yosef H. Pilch. (1981). A Distribution-Free Test for Tumor-Growth Curve Analyses with Application to an Animal Tumor Immunotherapy Experiment. Biometrics, 37, 383-390. http://www.jstor.org/stable/2530427 http://doi.org/10.2307/2530427
Used with permission of James Koziol.
References
Also appears in Dawson 1997 (with different mouse numbering).
Examples
data(tumor)
library(lattice)
xyplot(size~day|group, data=tumor, groups=mouse, type='l',
       main="Tumor growth over time for each mouse",
       xlab="Day", ylab="Tumor size",
       layout=c(3,1))