Uniformity trial of maize in Ecuador
mauricio.maize.uniformity.RdUniformity trial of maize in Ecuador 2022
Usage
data("mauricio.maize.uniformity")Format
A data frame with 624 observations on the following 3 variables.
rowrow ordinate
colcolumn ordinate
yieldyield per plot g
Details
Conducted in Simon Bolivar canton in the province of Guayas, Ecuador, Apr-Sep 2022.
It seems likely that the yield values were plot weights in grams. Mauricio (page 39) says the experiment yield was 220 qq/ha (quintals/hectare). In Ecuador, 1 quintal is probably 100 pounds = 45.4 kg. (but could possibly be 100 kg). It is not clear how the mean yield 2040 g/plot could be converted to 220 qq/ha. Perhaps after drying the grain?
Basic units were 1 meter square. The optimal plot size was determined to be 8.8 m by 5.7 m.
Page 40. For the basic units: mean: 2040.2, Std Dev 162.5, CV = 8.0 percent.
Data provenance: Electronic version prepared by K.Wright from tables in Mauricio (2023) page 59-62.
Source
Mauricio, Montoya Pilozo José (2023). Determinación del tamaño óptimo de parcela experimental para ensayos en maíz (zea mays l.) mediante regresión múltiple. Dissertation. Universidad Agraria Del Ecuador. https://cia.uagraria.edu.ec/Archivos/MONTOYA
Examples
library(agridat)
data(mauricio.maize.uniformity)
dat <- mauricio.maize.uniformity
require(desplot)
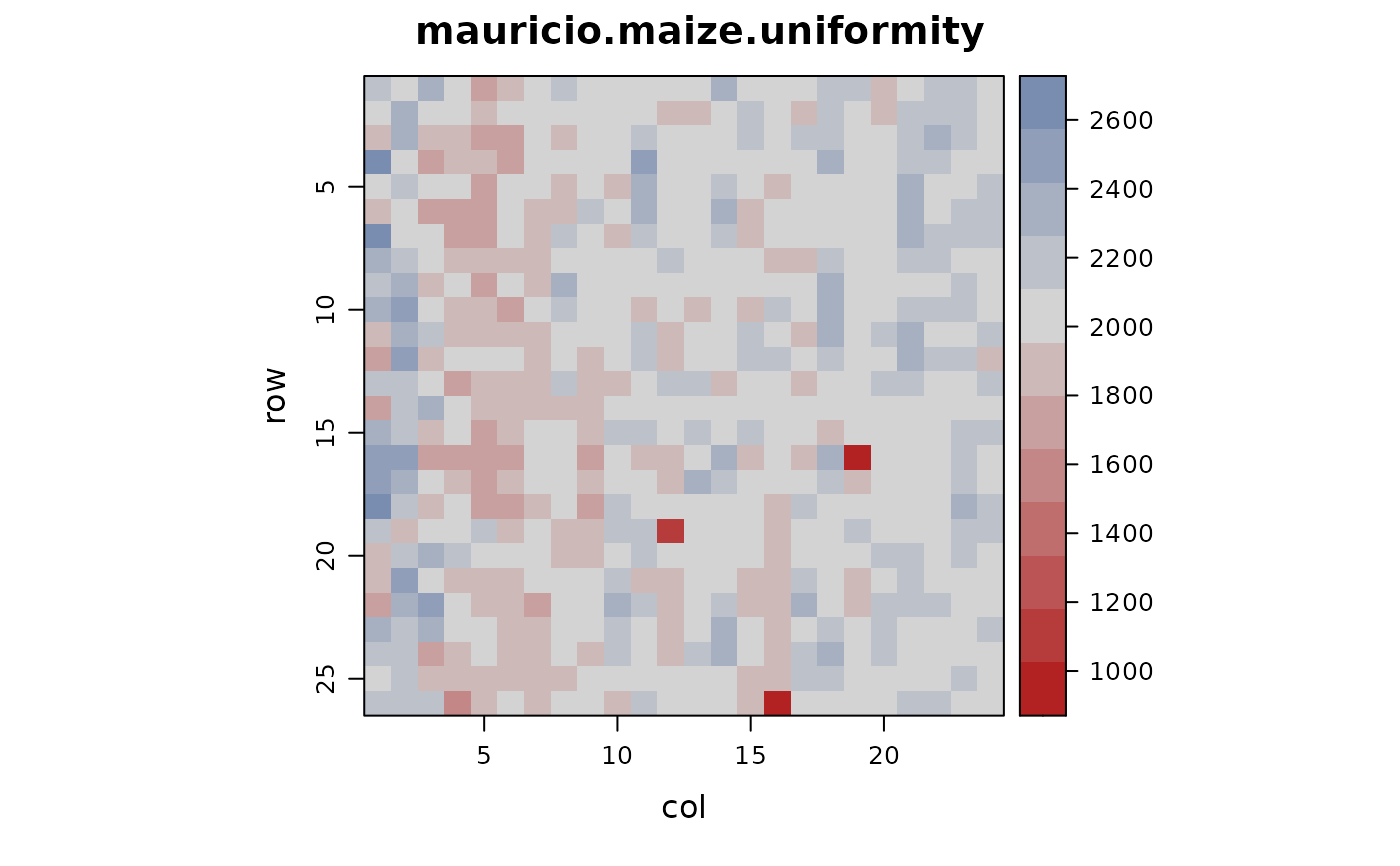
desplot(dat, yield ~ col*row,
flip=TRUE, aspect=(26*1)/(26*1), tick=TRUE,
main="mauricio.maize.uniformity")
 mean(dat$yield) # 2040.2 # match Mauricio
#> [1] 2035.346
sd(dat$yield) # 162.5
#> [1] 166.7513
mean(dat$yield) # 2040.2 # match Mauricio
#> [1] 2035.346
sd(dat$yield) # 162.5
#> [1] 166.7513