Homepage: https://kwstat.github.io/desplot
Repository: https://github.com/kwstat/desplot
desplot makes it easy to plot experimental designs of field trials in agriculture.
Key features
Flexible options to customize appearance of graphic.
Stable, well-tested using lattice graphics.
Beta version using ggplot2 graphics. Note ggplot2 is about 4 times slower.
Installation
# Install the released version from CRAN:
install.packages("desplot")

# Install the development version from GitHub:
install.packages("devtools")
devtools::install_github("kwstat/desplot")
Example 1
This data is is from a split-plot experiment with 6 replicates. The replicates are shown by the colored regions and outlined by the thick lines. The text codes and the thin lines define the whole-plots. The nitrogen sub-plot treatments are shown by the text colors.
require(agridat)
require(desplot)
desplot(yates.oats, block ~ col+row,
        col=nitro, text=gen, cex=1, aspect=511/176,
        out1=block, out2=gen,
        out2.gpar=list(col = "gray50", lwd = 1, lty = 1))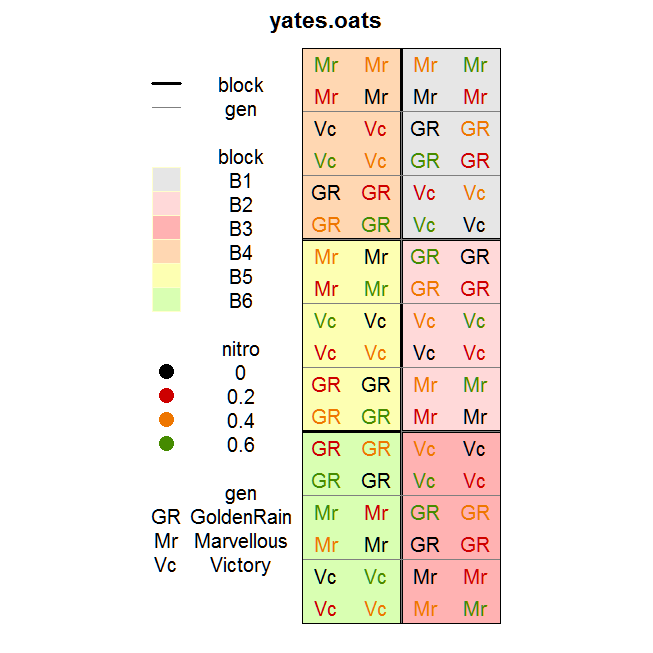
The default graphics are based on lattice. It is also possible to create graphics based on ggplot2 by adding ‘gg=TRUE’ to the function. This functionality is in development and the legend for the ggplot version is not as polished as the lattice version.
require(agridat)
require(desplot)
desplot(yates.oats, block ~ col+row,
        col=nitro, text=gen, cex=1, aspect=511/176,
        out1=block, out2=gen,
        out2.gpar=list(col = "gray50", lwd = 1, lty = 1), gg=TRUE)
        # note, out2.gpar is ignored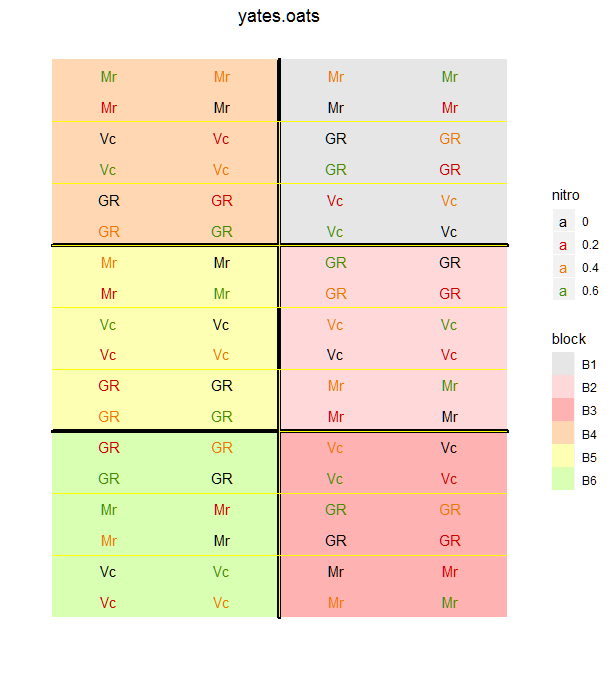
Example 2
Another very useful technique is to color the cells according to a continuous response variable (such as plot yield).
require(agridat)
require(desplot)
desplot(yates.oats, yield ~ col*row,
        col=gen, num=nitro, cex=1, out1=block, aspect=511/176)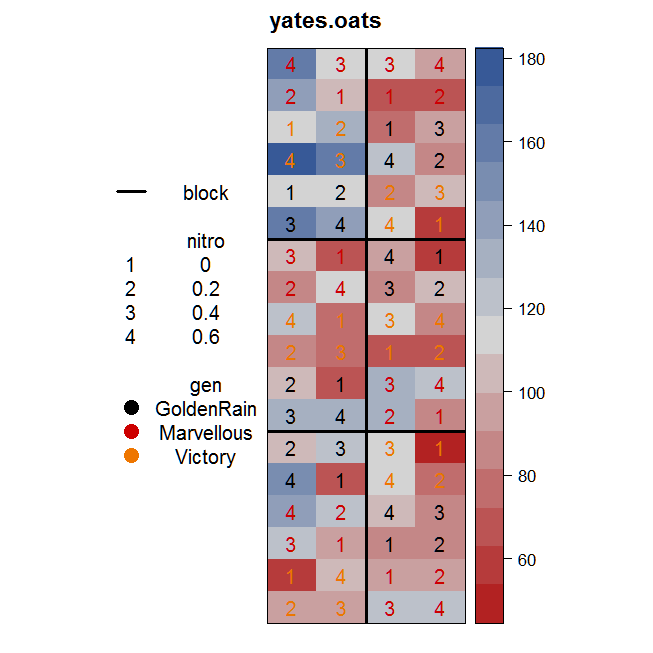
Example 3
Multiple locations can be shown in a single figure. Data quality for each cell can be indicated with a slash drawn across questionable values and an X drawn across bad values.
require(agridat)
require(desplot)
bmet <- agridat::besag.met
# Simulate a data quality flag
bmet$flag <- sample(c("G","Q","B"), nrow(bmet), replace=TRUE, prob=c(0.8,0.1,0.1))
desplot(bmet, yield ~ col*row|county,
        main="besag.met",
        num=gen, out1=rep, dq=flag,
        aspect=1.0)