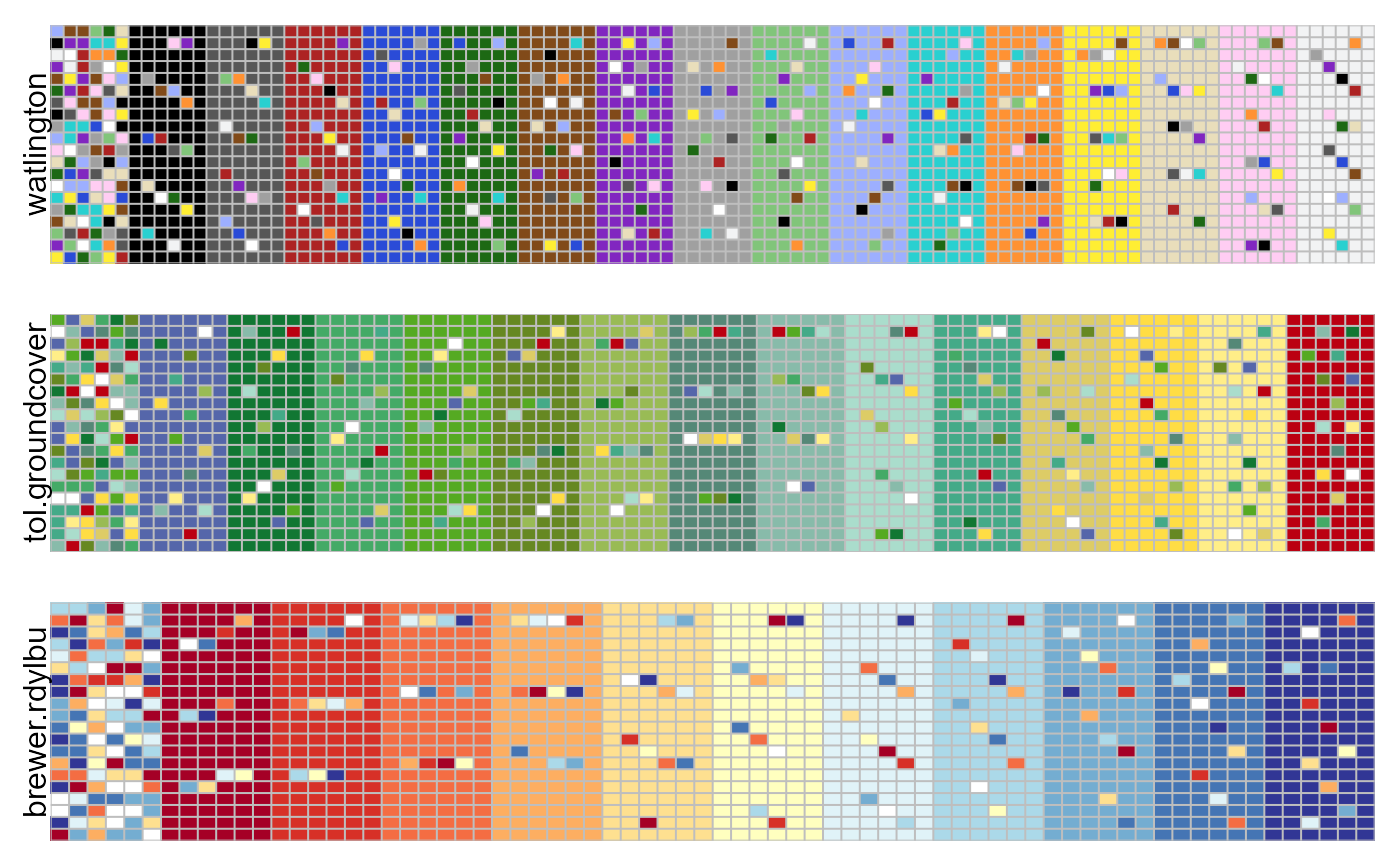
Draw a heatmap for each palette. Each palette heatmap consists of a block of randomly-chosen colors, plus a block for each color with random substitutions of the other colors. A missing value NA is added to each palette of colors.
Arguments
- ...
Palettes/colormaps, each of which is either (1) a vectors of colors or (2) a function returning a vector of colors.
- n
The number of colors to display for palette functions.
- nc
The number of columns in each color block.
- nr
The number of rows in each color block.
- labels
Vector of labels for palettes
Examples
pal.heatmap2(watlington(16), tol.groundcover(14), brewer.rdylbu(11),
  nc=6, nr=20,
  labels=c("watlington","tol.groundcover","brewer.rdylbu"))