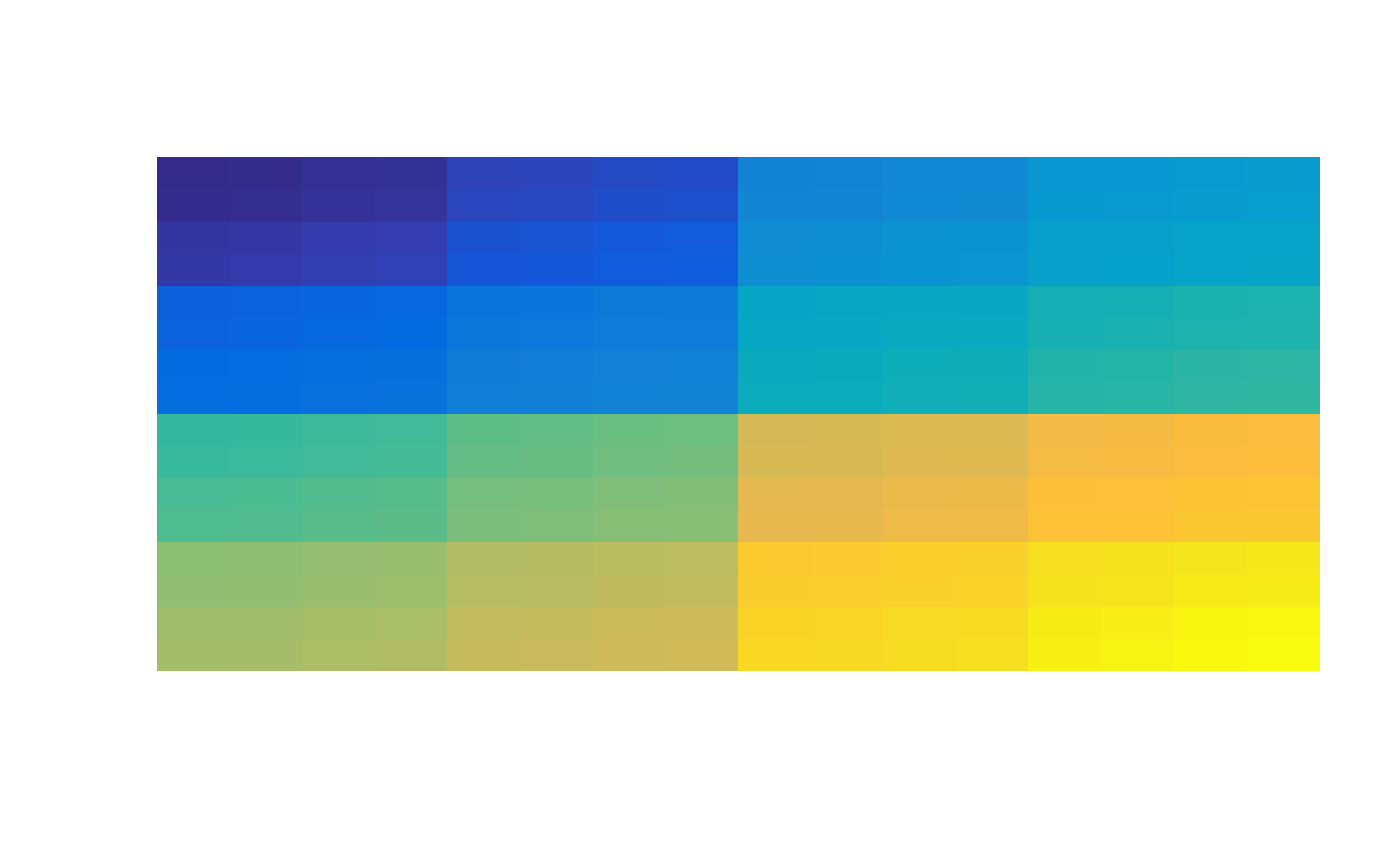
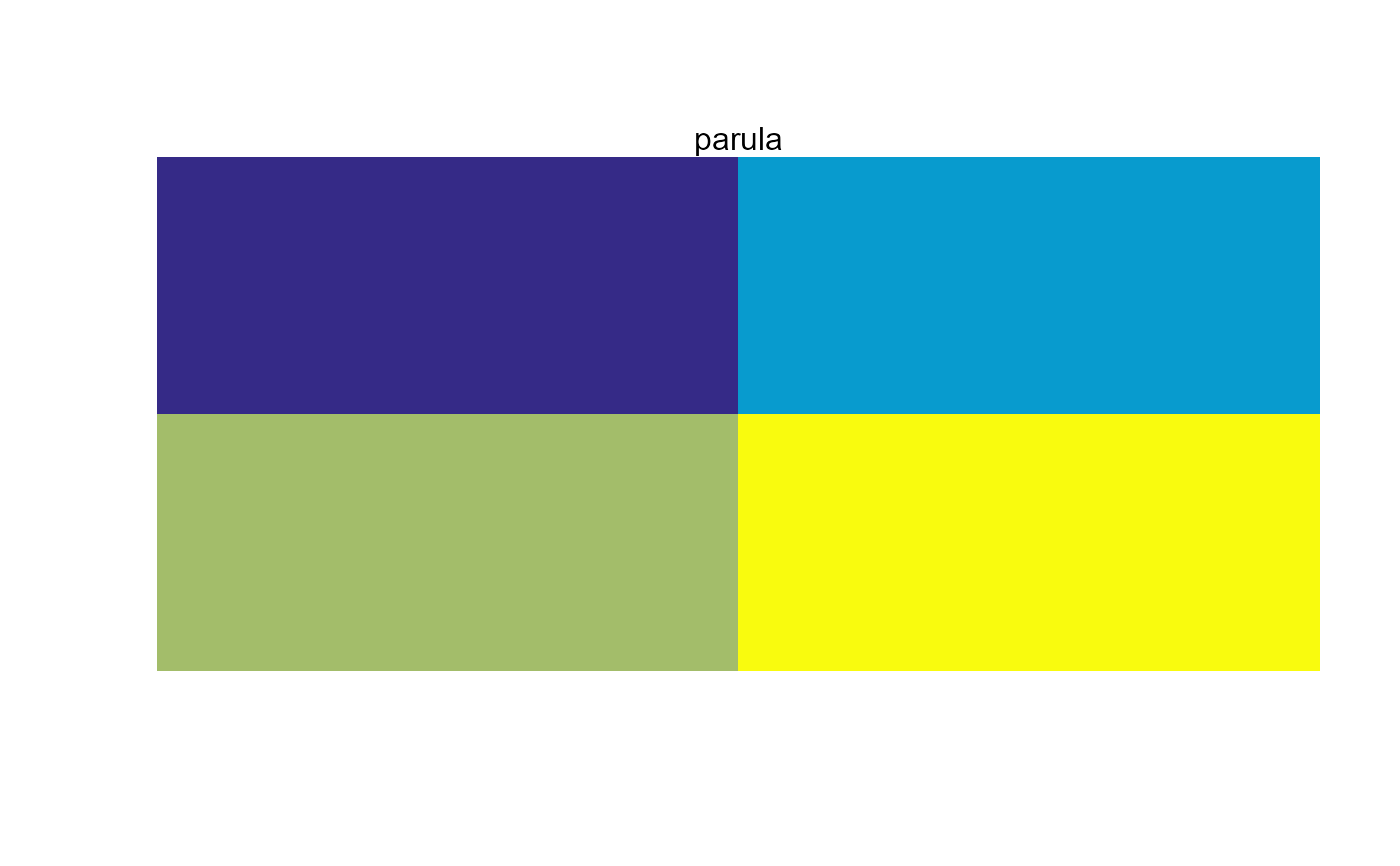
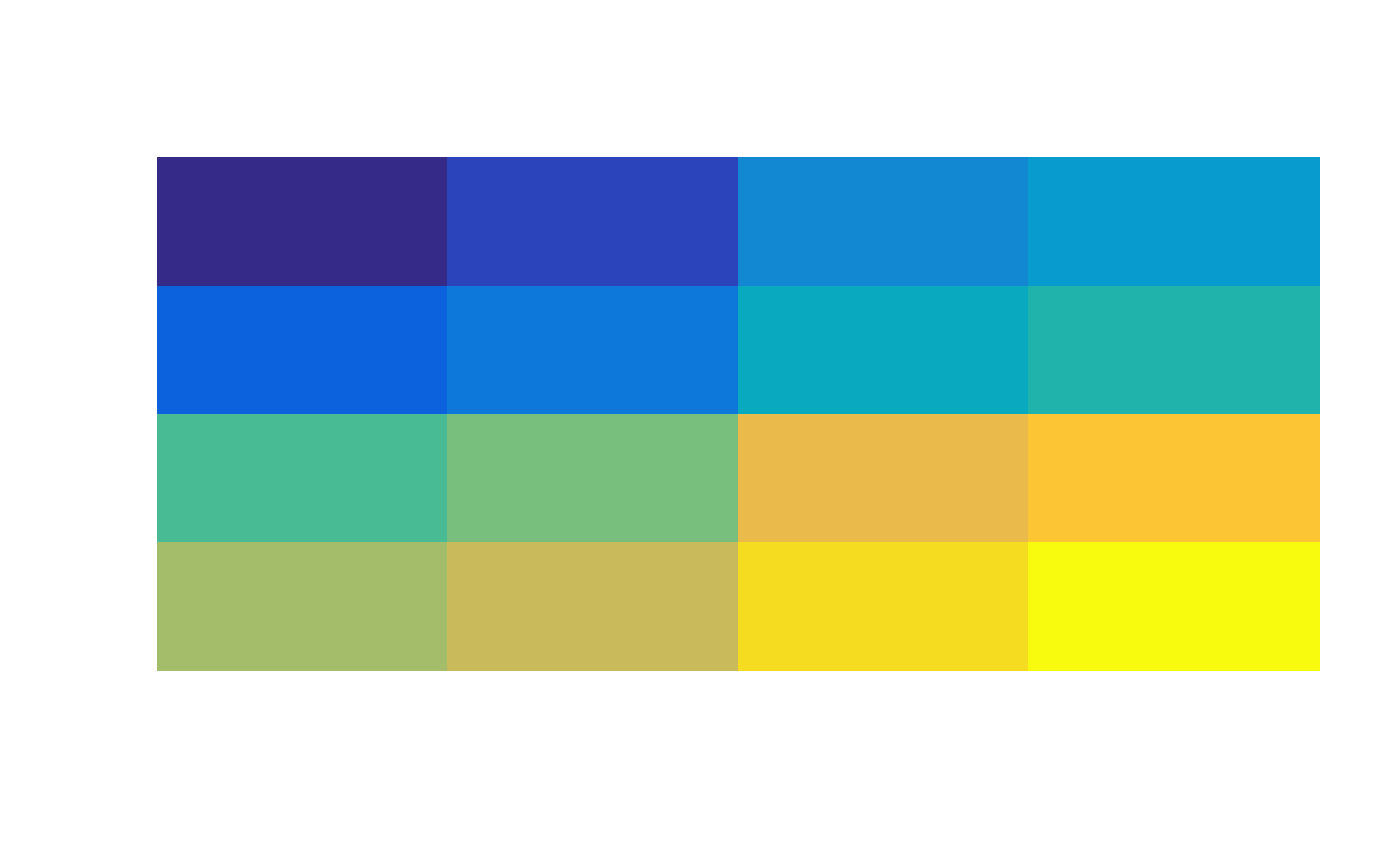
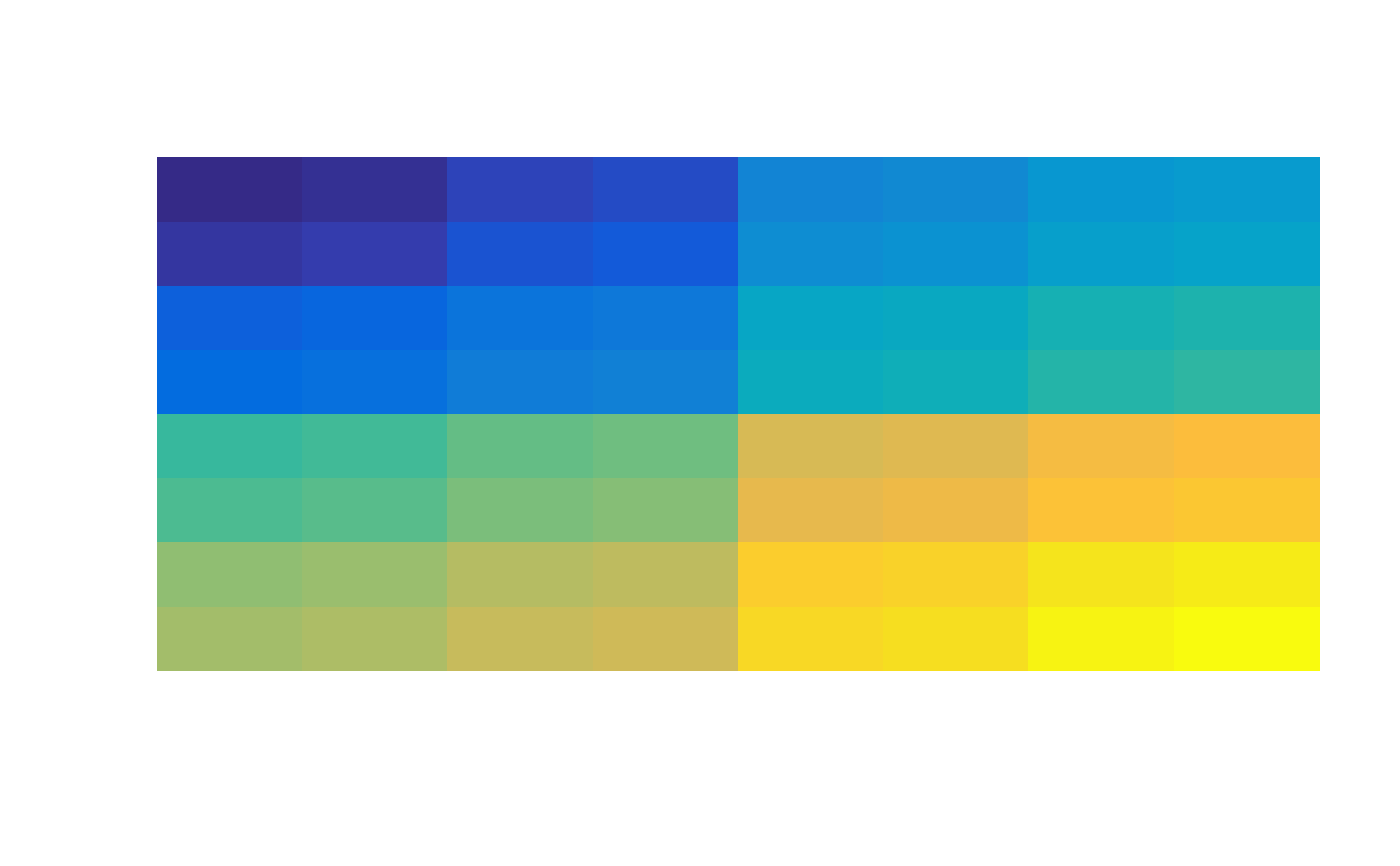
Construct a Z-order curve, coloring cells with a colormap.
The difference in color between squares side-by-side is 1/48 of the full range.
The difference in color between one square atop another is 1/96 the full range.
Usage
pal.zcurve(pal, n = 64, main = "")
Arguments
- pal
A continuous color palette function
- n
Number of squares for the z-curve
- main
Main title
Details
What to look for:
1. A good color palette of 64 colors should be able to resolve 4 sub-squares
within each of the 16 squares.
References
Peter Karpov. 2016.
In Search Of A Perfect Colormap. https://twitter.com/inversed_ru
Z-order curve. https://en.wikipedia.org/wiki/Z-order_curve
Examples
pal.zcurve(parula,n=4,main="parula")

pal.zcurve(parula,n=16)

pal.zcurve(parula,n=64)

pal.zcurve(parula,n=256)