Homepage: https://kwstat.github.io/corrgram
Repository: https://github.com/kwstat/corrgram
The corrgram package provides a simple way to create correlograms from raw data or a correlation matrix.
Package overview
The corrgram package provides functions for creating corrgrams using three different graphics systems, base, grid, and lattice.
Base R graphics
- single function
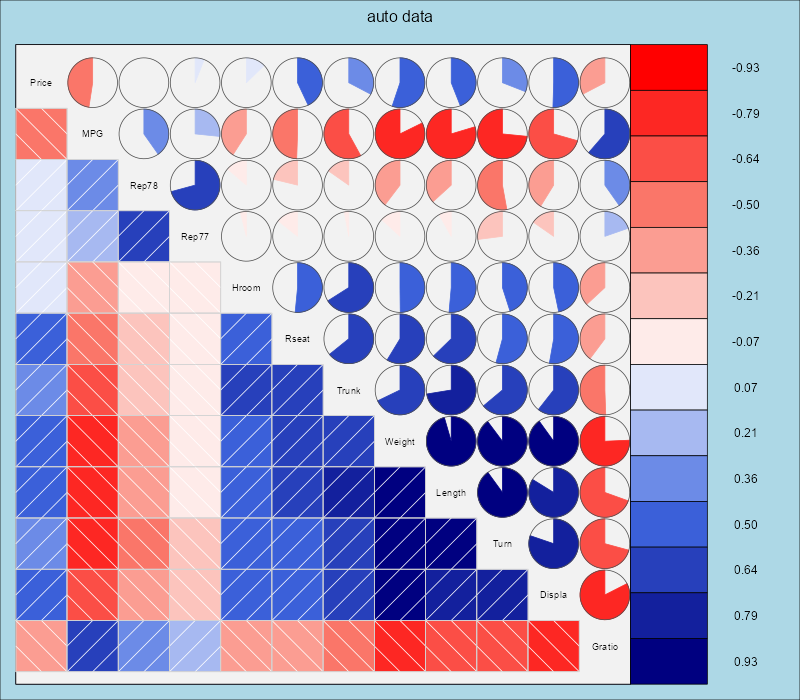
corrgram()for dataframes or matrices. - Enables most features found in the paper by @friendly2002corrgrams.
- No automatic legend.
- Not easily combined with other graphics.
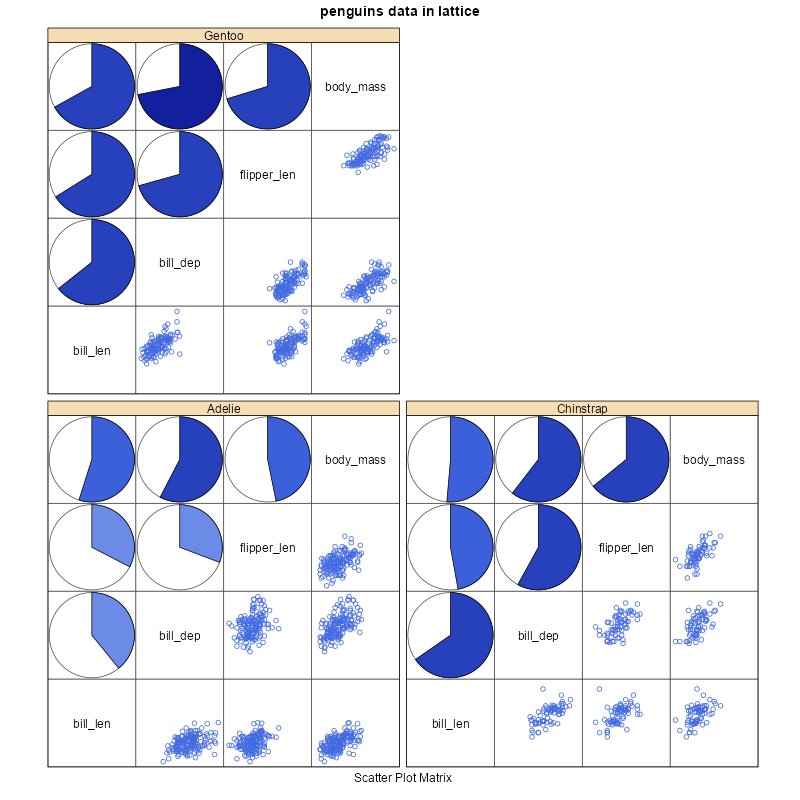
lattice graphics
- Separate panel functions for
lattice::levelplot()for dataframes andlattice::splom()for correlation matrices. - Enables automatic legend.
- Enables corrgrams conditioned on other variables.
- Can be combined with other lattice graphics for complex figures.
- Not feature complete compared to base R.
grid graphics
- single function
corrgram2()for either dataframes or correlation matrices. - Enables automatic legend.
- Can be combined with other grid graphics for complex figures.
- Not feature complete compared to base R.
- Faster than base R when evaluated inside Positron.
Installation
# Install the released version from CRAN:
install.packages("corrgram")

# Install the development version from GitHub:
install.packages("devtools")
devtools::install_github("kwstat/corrgram")
Usage for base R
require(corrgram)
# Base R
corrgram(mtcars, order=TRUE, lower.panel=panel.shade, upper.panel=panel.pie,
         text.panel=panel.txt, main="mtcars")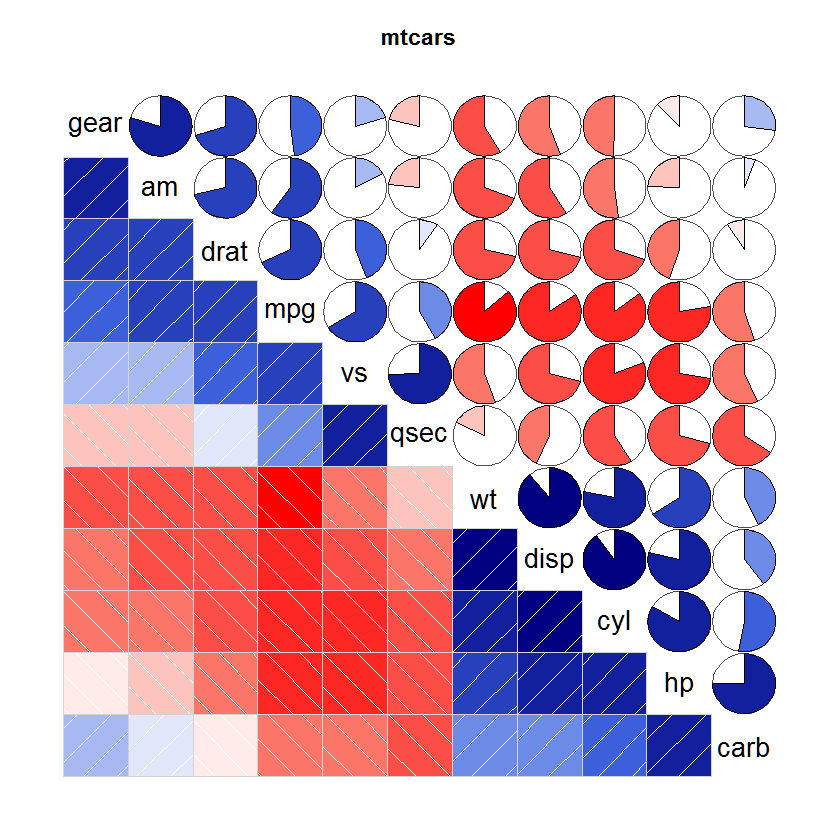
corrgram